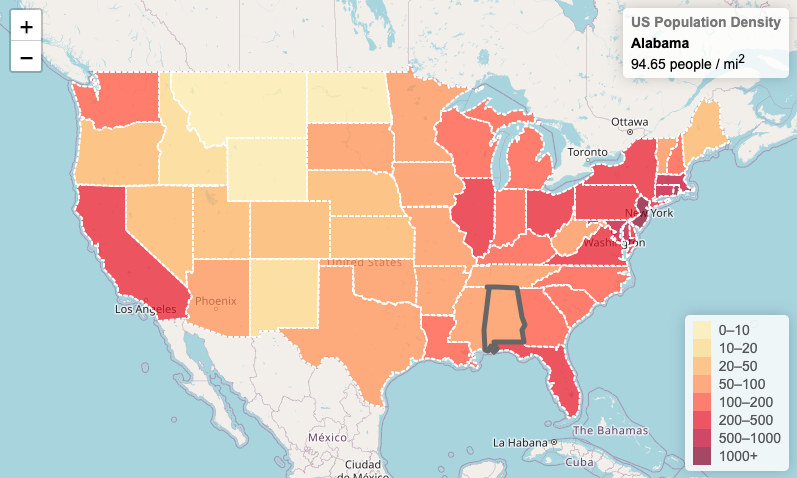
互動式分級著色圖
(上一篇)介紹使用 Leaflet,並簡單的在上面加個 marker, 接下來進階到畫出個分級著色圖,讓資訊與地區的概念同時顯示在地圖上,ex: 將美國各區的人口密度以不同顏色顯示在地圖上。
code 示範
以下的 code 複製直接可 run (當然要有 web server, like nginx or tomcat..etc)
1
2
<!DOCTYPE html>
code 解說
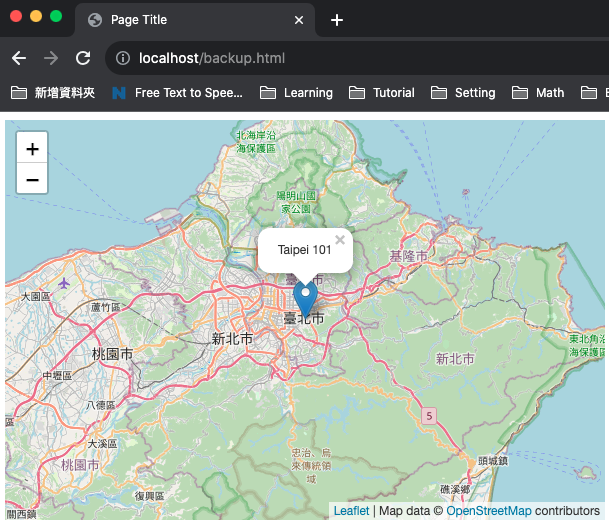
<link rel="stylesheet" href="https://unpkg.com/leaflet@1.7.1/dist/leaflet.css" />-> 引入 Leaflet CSS 文件<script src="https://unpkg.com/leaflet@1.7.1/dist/leaflet.js"></script>-> 引入 Leaflet JavaScript 文件var map = L.map('map').setView([25.0330, 121.5654], 10);-> 創建地圖對象並設置初始的 viewL.tileLayer('https://{s}.tile.openstreetmap.org/{z}/{x}/{y}.png',-> 添加地圖圖層 (如 OpenStreetMap)L.marker([25.0330, 121.5654]).addTo(map) .bindPopup('Taipei 101') .openPopup();-> 在地圖上添加標記
執行結果
約 30 行的 codes, 就可以顯示出地圖了,簡單吧