Visualizing Python Package Dependencies
In the previous article, we demonstrated how to use pipdeptree to output the dependencies between packages. However, both console and JSON outputs can be difficult to read, especially as the number of packages increases. Here, we will use networkx to visualize the Python package dependencies, making it easier to understand at a glance with a single image.
Introduction to networkx
NetworkX is a Python library for creating, manipulating, and studying complex network structures (or graphs). It provides many convenient functions to handle graph structures, which can be undirected graphs, directed graphs, multigraphs, etc. Here are some key features and uses of NetworkX:
Various Graph Types
- Graph: Used to represent undirected graphs.
- DiGraph: Used to represent directed graphs.
- MultiGraph and MultiDiGraph: Used to represent multigraphs (allowing multiple edges).
Rich Graph Operations
- Add/Delete nodes and edges.
- Compute graph properties (e.g., degree, diameter, connected components).
- Graph traversal (e.g., depth-first search, breadth-first search).
- Shortest path algorithms (e.g., Dijkstra, Bellman-Ford).
- Graph visualization.
- Graph analysis and algorithms:
Clustering and community detection.
- Network centrality measures (e.g., PageRank, Betweenness).
- Random graph generation.
In this example, we will primarily use NetworkX to output an image of the dependency graph.
You can install NetworkX with the following command
1
pip install networkx
Demonstration
Output JSON
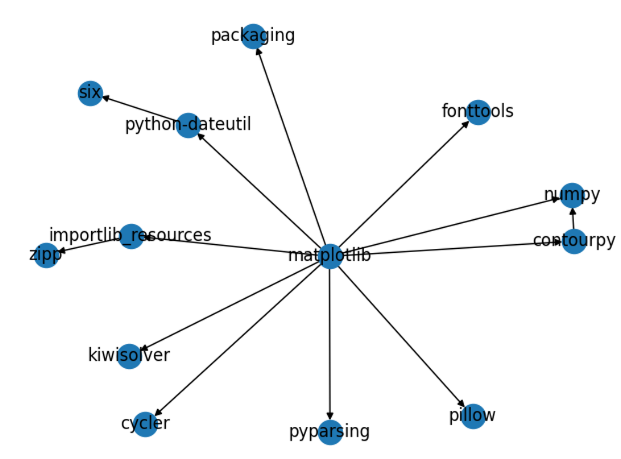
Let’s use pipdeptree to see how many dependencies matplotlib has:
1
pipdeptree --json --packages matplotlib > dependencies.json
This will output a dependencies.json file.
Visualizing with networkx
The following code reads the dependencies.json file generated in the previous step, creates a directed graph using NetworkX, and adds the data to display it.
1
2
3
4
5
6
7
8
9
10
11
12
13
14
15
16
17
18
19
20
21
22
23
24
25
26
27
28
29
30
31
32
import json
import networkx as nx
import matplotlib.pyplot as plt

# Read the JSON file
with open('dependencies.json', 'r') as f:
    data = json.load(f)

# Create a directed graph
G = nx.DiGraph()

def add_edges(node):
    """ Recursively add edges to the graph """
    package_name = node['package']['package_name']
    if 'dependencies' in node:
        for dep in node['dependencies']:
            dep_name = dep['package_name']
            G.add_edge(package_name, dep_name)
            # Recursively process dependencies
            add_edges({
                'package': {'package_name': dep_name},
                'dependencies': []  # Because there's no deep structure of the dependency tree
            })

# Add edges starting from the root node
for root in data:
    add_edges(root)

# Draw the graph
pos = nx.spring_layout(G, k=0.5)
nx.draw(G, pos, with_labels=True, arrows=True)
plt.savefig('dependencies_tree.png')
Note: You can adjust the nx.spring_layout and nx.draw functions to make your graph more visually appealing.
matplotlib
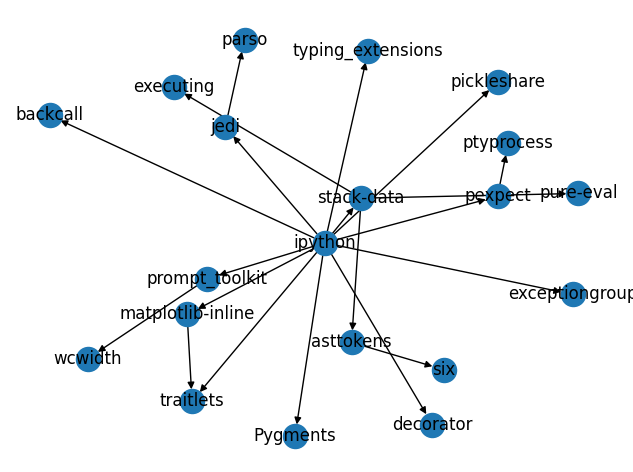
ipython
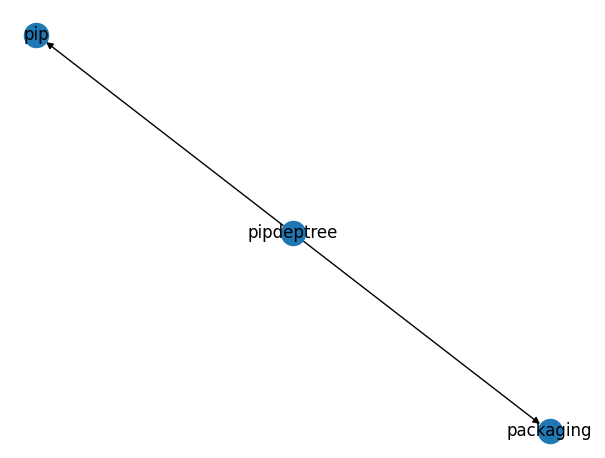
pipdeptree