Debugging Python code in Visual Studio Code (VS Code) is very convenient. Just follow these steps to start debugging your Python code
Install Python Extension
Here are the steps to set up and use VS Code for Python debugging:
Install Python Extension
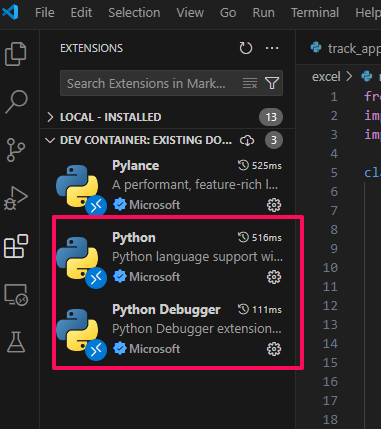
Open VS Code. Go to the Extensions Marketplace (square icon on the left sidebar). Search for and install the “Python” extension (provided by Microsoft).
Set Up Debug Configuration
Open the Python project or file you want to debug.
Open the Debug view (bug icon on the left sidebar).
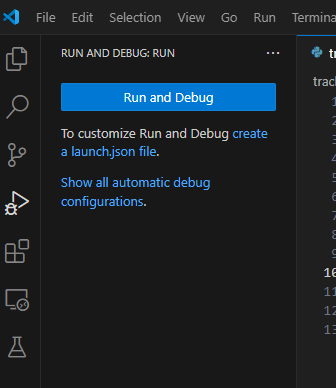
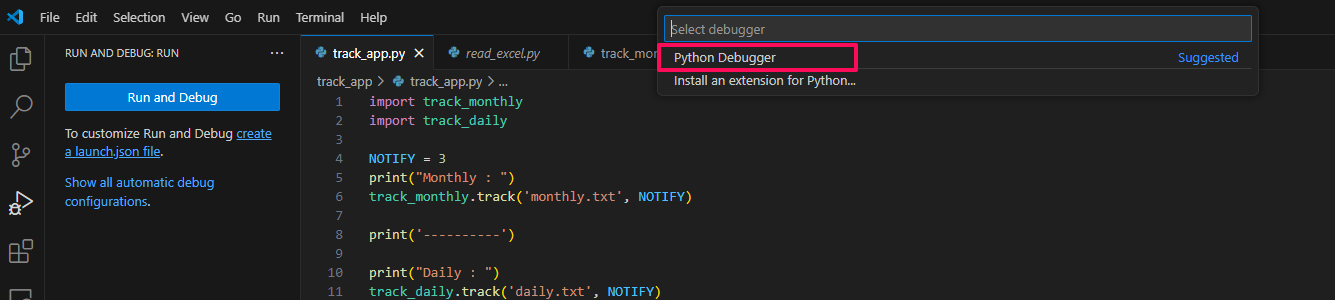
Click the gear icon at the top to open the launch.json debug configuration file. If you haven’t configured it before, VS Code will prompt you to select an environment. Choose “Python”.
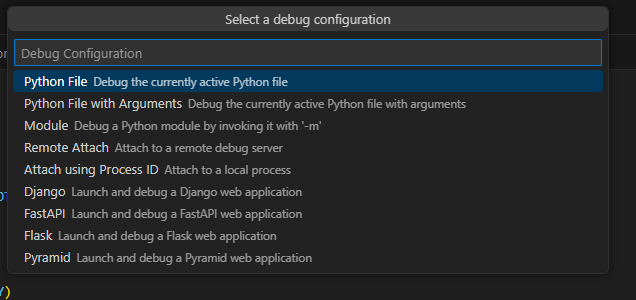
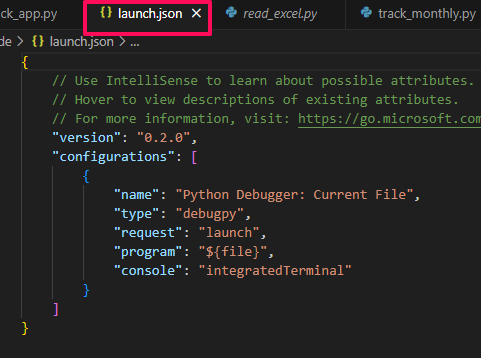
This will generate a default launch.json file with basic debug configurations. You can modify it as needed.
Set Breakpoints
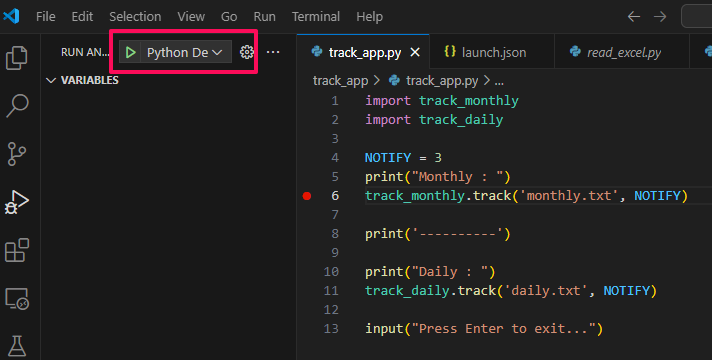
In your Python file, click the empty space to the left of the line numbers to set breakpoints (F9). Breakpoints are places where the program will pause execution so you can inspect variables and the program’s state.
Start Debugging:
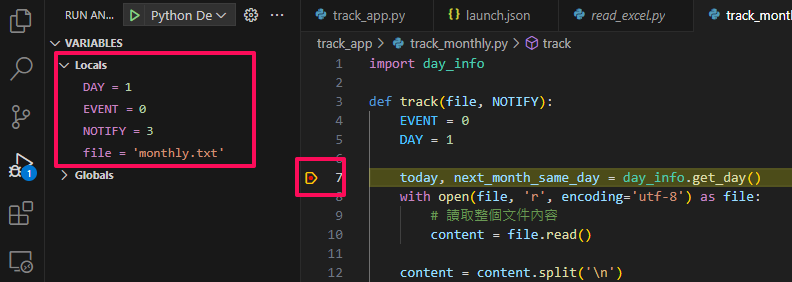
In the Debug view, select the debug configuration you set up in the launch.json file (e.g., “Python: Current File”). Click the green play button to start debugging. The program will run and pause at the breakpoints you set. At this point, you can inspect variables, the call stack, and perform step-by-step execution.
Common Debugging Actions
The debug control panel will appear at the top of VS Code, containing the following common actions:
- Continue (
F5): Resume program execution until the next breakpoint or program termination. - Step Over (
F10): Execute the current line of code, skipping over function calls. - Step Into (
F11): Step into the function call on the current line. - Step Out (
Shift+F11): Step out of the current function. - Restart Debugging (
Ctrl+Shift+F5): Restart the debugging session. - Stop Debugging (
Shift+F5): Stop the debugging session.
That’s it!